Pull twelve months of incident data for any large estate and a familiar shape appears before you finish the query. A small cluster of services dominates the pager. A small set of failure modes dominates the cluster. The distribution is so consistent across organizations that it has the character of a physical law, which is roughly how it entered the literature.
The Law and Where It Came From
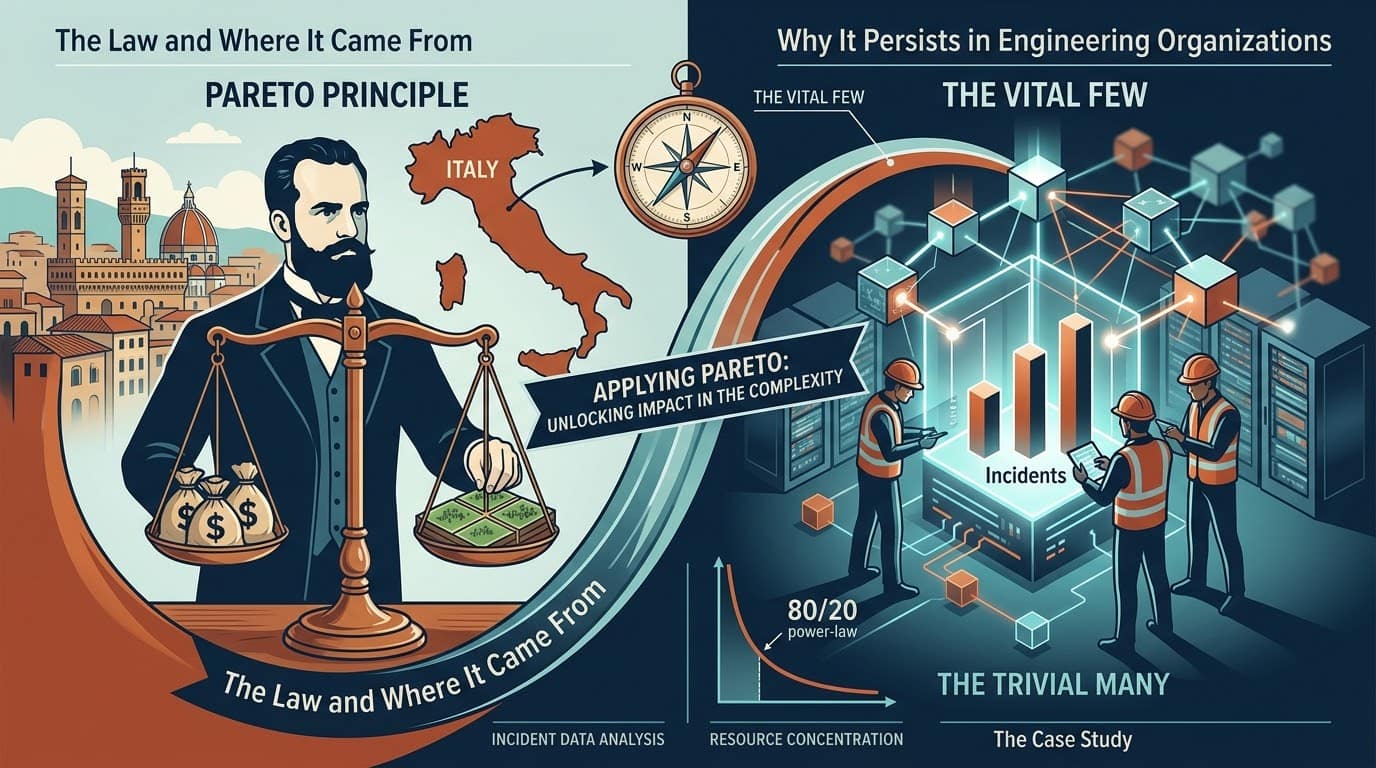
Vilfredo Pareto, an Italian economist, observed in his 1896 Cours d’économie politique that roughly 80 percent of Italy’s land was owned by 20 percent of the population, a ratio he found recurring across countries and eras. The generalization into a management principle belongs to Joseph Juran, the quality pioneer, who in the 1940s named it the Pareto Principle and gave it its operational phrasing: the vital few and the trivial many. Juran’s insight was not the ratio. It was the instruction that comes with it: find the vital few and concentrate there.
The numbers 80 and 20 are mnemonic, not mathematical. Real distributions run 90/10, 70/30, sometimes 99/1. What matters is the underlying structure: power-law distributions, which arise naturally wherever preferential attachment or compounding operates. Software systems are full of both, which is why the principle shows up in defect density, traffic patterns, feature usage, and cost allocation with such regularity.
Why It Persists in Engineering Organizations
The principle itself is not the problem. The problem is that enterprise resource allocation is structurally biased toward the trivial many. Budgets are distributed by org chart, not by impact concentration. Modernization programs aim for uniform coverage because uniform coverage is easy to govern and easy to report. A roadmap that touches forty services reads as more ambitious than one that rebuilds three, even when the three carry the load.
Microsoft’s research on defect distribution found that a small fraction of modules accounts for the large majority of field defects, a result replicated across decades of software engineering studies. Feature usage follows the same curve: the Standish Group’s often-cited analysis reported that a large majority of built features are rarely or never used. Every architect has seen the internal version of this: the sprawling configuration system with four active configurations, the twelve-format export engine where one format carries 95 percent of volume.
AI investment is currently repeating the pattern at speed. Organizations scatter copilots and pilots uniformly across functions, produce a thin layer of demos, and miss the two or three workflows where the economics are concentrated. The 80/20 question for AI transformation is not “where can we apply this” but “where does the value distribution actually peak,” and most portfolios have never been analyzed that way.
Case Study: The Reliability Program That Fixed Three Services
The following is an anonymized composite drawn from patterns common to large service estates.
A retail platform organization ran roughly 240 services and carried a reliability problem severe enough to reach the board: customer-facing availability had missed target for three consecutive quarters. The initial proposal was characteristic of enterprise instinct, a two-year program to bring all 240 services to a uniform operational maturity standard, with scorecards, gates, and a dedicated PMO.
A staff engineer ran the Pareto analysis first. Fourteen services, six percent of the estate, had generated 81 percent of customer-impacting incident minutes over the trailing year. Within those fourteen, three services accounted for nearly half the total, and each of the three failed in one dominant mode: a checkout service that fell over under connection pool exhaustion during traffic spikes, an inventory cache with a thundering-herd invalidation pattern, and a payment gateway adapter with no circuit breaking against a flaky upstream.
Leadership took the uncomfortable bet: defer the uniform program, put senior engineers on the three services for one quarter. Connection pooling was rearchitected, the cache moved to staggered expiry with request coalescing, and the adapter got circuit breakers and load shedding. Customer-impacting incident minutes fell 58 percent the following quarter. The estate-wide maturity program eventually ran, but scoped and unhurried, because the crisis was over. The scorecard had wanted to boil the ocean. The distribution said to boil three cups.
What To Do About It
- Run the analysis before the program. Incident minutes by service, cost by workload, revenue by feature, defects by module. The data usually exists and the query takes an afternoon. The distribution is your prioritization document.
- Fund concentration, not coverage. Resist the governance instinct to spread investment evenly. A program that transforms the vital few outperforms one that lightly touches everything, and it produces results fast enough to sustain sponsorship.
- Apply it to your own attention. An architect’s calendar follows the same law: a handful of decisions carry most of the consequence. Identify which reviews and designs are in the vital few and defend the time accordingly.
- Watch the tail, but differently. The trivial many are not ignorable, they are manageable in bulk: standard patterns, paved roads, automation. Concentrated effort for the head of the distribution, economies of scale for the tail.
- Re-run it. Power-law distributions shift as you fix the head. Yesterday’s vital few, once resolved, reveal a new head. Pareto analysis is a rhythm, not a one-time study.
The Architect’s Takeaway
The Pareto Principle is the cheapest strategic tool available to a technology organization: one query that tells you where reality has concentrated the stakes. The discipline is acting on it, because acting on it means telling most of the estate, and most of the org chart, that they are not the priority this quarter. That conversation is the actual price of the 80/20 rule. Systems follow power laws. Budgets follow politics. Closing that gap is the job.
Next in the series: the Peter Principle, and what happens when you promote your best engineer out of engineering.
The Laws We Ignore | Part 4 of 11
Previous: Part 3: Hanlon’s Razor | Next: Part 5: The Peter Principle
ok