
Engineering teams are making a massive miscalculation with AI. We treat it as a tool that magically delivers better work, faster. It doesn’t.
AI does not give you speed. It gives you a time surplus, and your engineering outcomes depend entirely on what you buy with that surplus. Right now, the industry is buying speed. And it is costing us quality.
Here is the reality of AI-assisted development, backed by the numbers, and how we can flip the script to find the equilibrium point where AI actually works for us, not against us.
One of these claims is already proven. The rest have never been tested by anyone.
And notice the y-axis. It is quality, not time. That choice is itself one of the paper’s main claims, and it leads the so-what list below.
The “Ship First-Done” Deficit
Understanding AI Code Quality vs Speed
If you compress your timelines because AI helped you write code faster, you are likely shipping below your own pre-AI quality bar. This isn’t a theory; it is a measurable deficit. Four independent research groups, using four different methods, have all pointed in the exact same direction:
- Bugs are up 41%: Uplevel tracked roughly 800 developers and found Copilot users produced 41% more bugs in pull requests, with zero throughput improvement.
- Code churn has doubled: GitClear analyzed 211 million changed lines. Code revised within two weeks of commit has doubled since the pre-AI baseline. Furthermore, 2024 was the first year on record where copy-pasted code exceeded refactored code.
- Stability is dropping: Google’s DORA research ties every 25-point increase in AI adoption to a 7.2% decrease in delivery stability.
- The illusion of speed: METR ran a randomized trial where developers using AI were measurably slower, yet afterward, they believed they had been 20% faster.
This 39-point gap between feeling and fact is why the deficit persists. It is invisible to the people producing it.
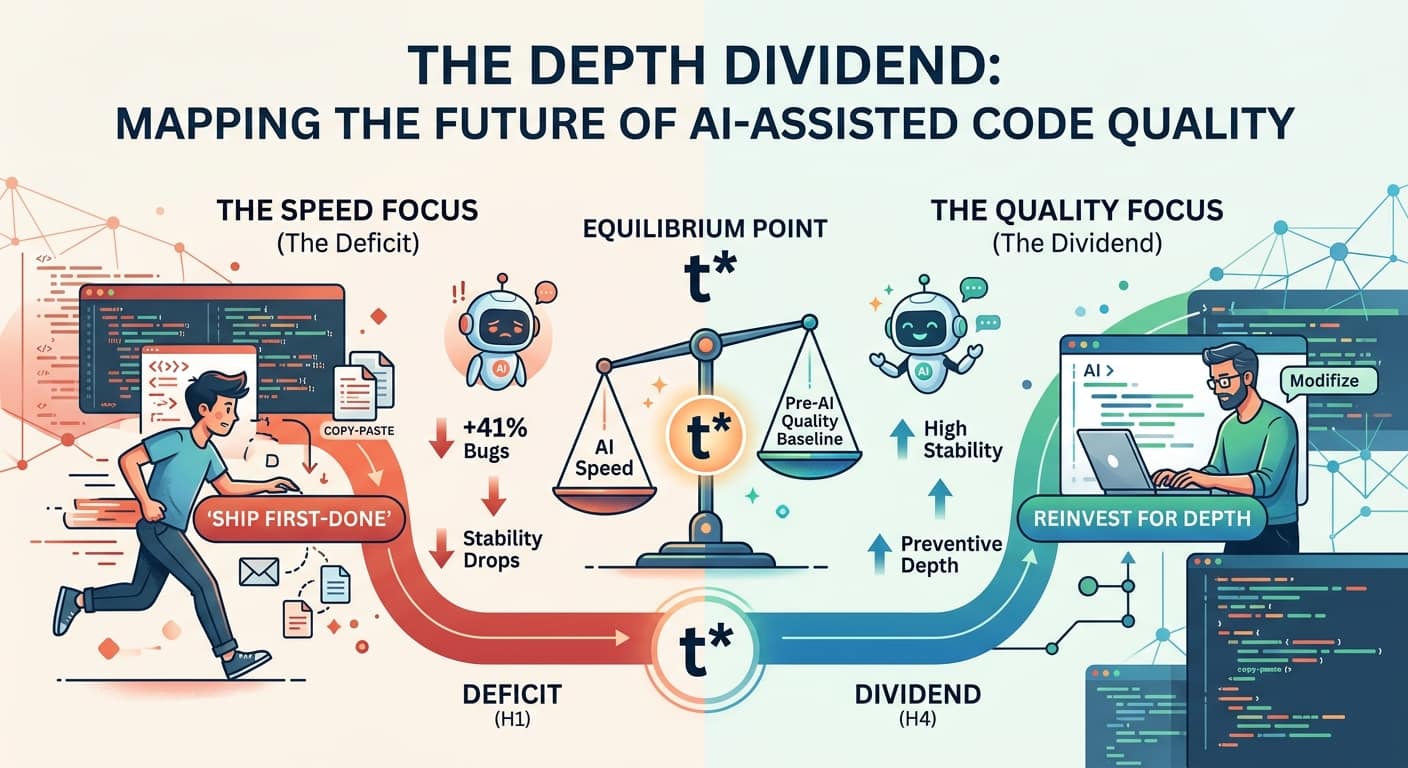
The Model in One Picture
If we stop spending our AI time surplus on speed, what happens if we spend it on depth?
H1 — The deficit. Shipped at first-done, AI-assisted work lands below the pre-AI quality baseline. Status: measured.
H2 — The recovery. Quality rises as the timeline extends and the saved time is spent on depth. Status: untested.
H3 — The equilibrium (t*). The minimum timeline at which AI-assisted work matches traditional quality. Status: unlocated.
H4 — The dividend. At the full traditional timeline, reinvested work exceeds the old bar. Status: untested.
This Dynamic is Already Running in Your Org Chart
The split between spending the AI surplus on “speed” vs. “depth” is not just theoretical. Look closely at your teams, and you will see it dividing along seniority lines right now.
- Juniors are running the speed allocation. They dominate volume metrics. One enterprise study clocked juniors shipping 77% more code with AI. But in a recent survey of 1,569 developers, only 16% of seniors say juniors fully understand the AI code they submit. Output without owned comprehension is the deficit in action.
- Seniors are running the depth allocation. They treat AI output like a pull request from a junior: read it, challenge it, redirect it. They report the highest quality gains and refuse to ship AI code unreviewed.
- Mid-career developers are the shock absorbers. Developers now spend more hours reviewing AI code than writing it (11.4 hours per week against 9.8). The review burden lands hardest on mid-level engineers who can spot bad AI generation but cannot dismiss it cheaply. They are quietly running the depth allocation without being asked—and no dashboard credits them for it.
How to Fix It: Find Your t*
The industry adopted this technology at 90% penetration without ever testing its most valuable configuration. Every published study compares “AI” against “no AI” and lets the clock float. Nobody is holding the timeline constant to see what reinvested time buys us.
Here is how engineering leaders can correct course immediately:
1. Stop anchoring your measurement on time. Anchor it on quality.
A week means nothing across projects; complexity makes time impossible to compare cleanly. In the AI era, time-anchored dashboards (like cycle time or PRs merged) improve precisely when quality declines. You must invert it: quality is the anchor, time is the derived variable.
2. Locate your Equilibrium Point (t*)
t* is a measurable reality: it is the shortest timeline at which AI-assisted work actually matches your traditional quality baseline. Schedule below t* knowingly for urgent, low-stakes work. But if you schedule below it by default, you are making a quality-reduction decision while falsely believing you made a speed decision.
3. Change what your dashboards celebrate
Speed is highly visible. Depth is preventive and invisible, it is the incident that never paged anyone at 2:00 AM. Put escaped defects, incident frequency, duplication density, and time-to-understand on the dashboard. Make them the anchor, not the footnote.
AI does not have to be a race to the bottom of the codebase. By recognizing the time surplus and deliberately spending it on quality depth, engineering teams can cash in on the dividend they were promised all along.